2018 was a good one for the Woods Advisory Services, LLC team. We continue to have more frequent and meaningful planning discussions with all of our clients. This has come via more correspondence and discussions of client’s specific goals and objectives. We started working with several of you last year and have added client relationships at a pace we feel comfortable with. It is obvious that clients are seeing the value of our full service planning methodology.
Personally life was good for the Woods’ crew as well. Our daughters continue to excel at school (the oldest is now a sophomore in high school) and athletics. In fact, dear old Dad (aka me) coached our youngest in basketball and lacrosse with both teams winning their respective championships. Oh and my beloved Capitals finally broke a 44 year curse winning the beautiful Stanley Cup in June!
Of course, not all was perfect last year. 2018 proved to be one of the more difficult investment years since the recession of 2008 (The so-called Great Recession). To be more specific, equity markets continued to roll along until they wobbled in Q4. From the market peaks of September 21 until the valley of third week in December, the S&P 500 fell nearly 20% which is historically the benchmark for a bear market (to be fair the markets ran back up the last week of the year). Many commentators and naysayers are predicting further losses and rough times. As I often do, I implore clients to ignore those naysayers and commentators. Their predictions will prove wrong both in direction and/or size more often than right. The markets are living, breathing organisms and to assume one can correctly predict the movement of that organism reeks of arrogance. It is simply too difficult to do with precision even once much less with any long term consistency.
Perspective
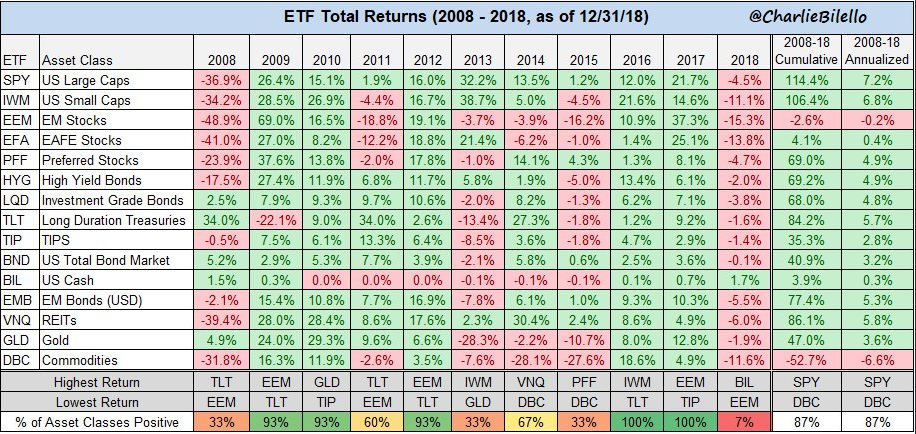
Yes 2018 ended with down markets across the 3 largest market index ETFs: S&P 500, Dow Jones Industrial Average and the Nasdaq 100. In fact, this was the first time any of those three ETFs were down since 2008 (total return which includes dividends):

(BTW Charlie Bilello’s charts are fantastic and I will be referring back to them throughout this post)
As you can see, the losses realized in these indexes last year pale in comparison to the performance of those same indexes since 2009. Of course 2018 performance numbers look better than they probably “feel” since the market highs were achieved in late summer. So the actual pullback from market highs are significantly higher than the losses listed in the chart. Nevertheless, the yearly results are what they are and provide a stark reminder of what a market run the last 10 years have been.
Drawdowns Aren’t Unusual
As great as the last 10 years have been from a return perspective, they have not been a straight line up. In fact, there have been 23 drawdowns of the S&P 500 of over 5% since the March 2009 lows.
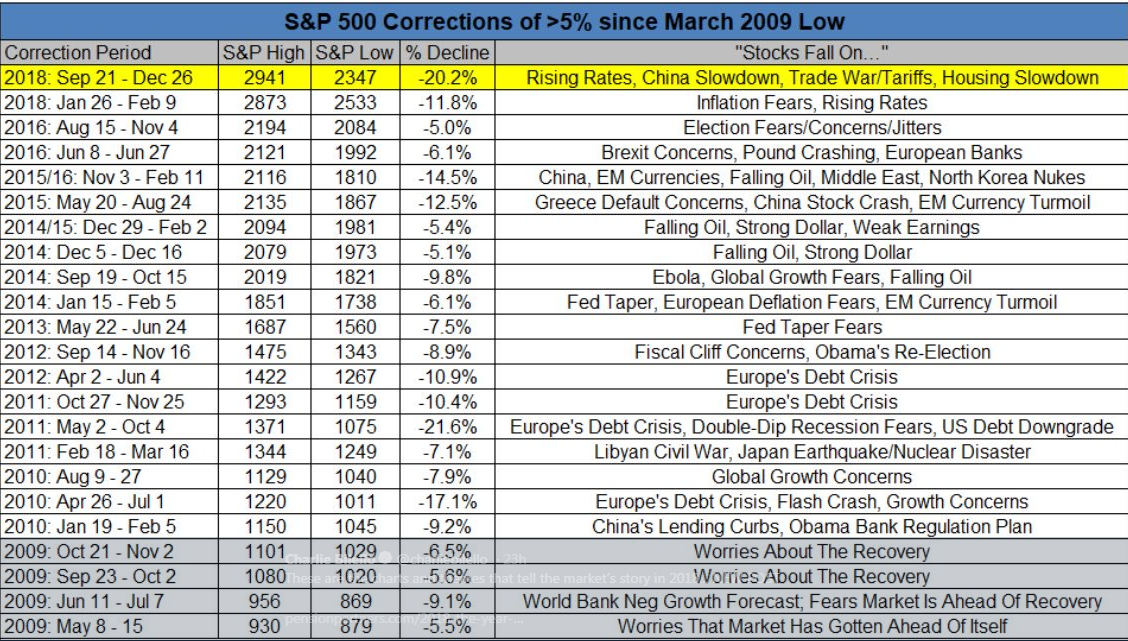
In a related post last summer, I detailed the frequency of these types of large drawdowns on the biggest market names:
Losses Across The Board
Almost all asset classes were in the red in 2018. The lone exception was cash. However, look at the 2008-2018 cumulative and annualized returns (these are total returns) for cash over that period as compared to the other asset classes-virtually no returns (Note that this table uses the largest ETF for asset class as a proxy for the full market performance of each asset class):
In addition to the general asset class losses, almost all of the largest economies worldwide suffered losses in 2018.
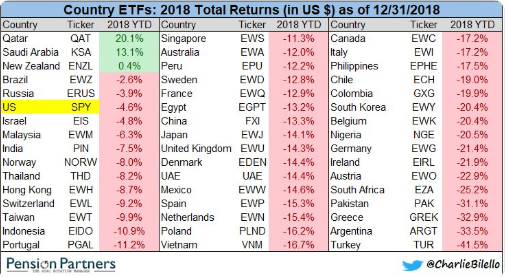
Obviously, most of these economies are miniscule in comparison to the US and other developed nations. Nevertheless, this chart reinforces the pervasive down markets worldwide in 2018.
So What’s Next?
As you know, I am unwilling to make predictions (i.e. guesses) about future market performance. As I have stated repeatedly, I simply don’t believe there is evidence that these predictions have any value other than filling up columns online and in trade publication. The ability to accurately predict the future of a market consisting of millions and millions of players worldwide is simply unrealistic. Rather, I will continue to assist clients determine their future needs and implement investment strategies around those needs.
More often than not, investor behavior is the cause for poor performance rather than any other variable. Trying to time the markets, moving in and out of certain funds or ETFs or taking on more or less risk than one is comfortable with are common examples of poor investor behavior. If the last three months of client contact is any indication, our clients buy in to that theory and we believe that is for the best. Let’s see that that continues.